
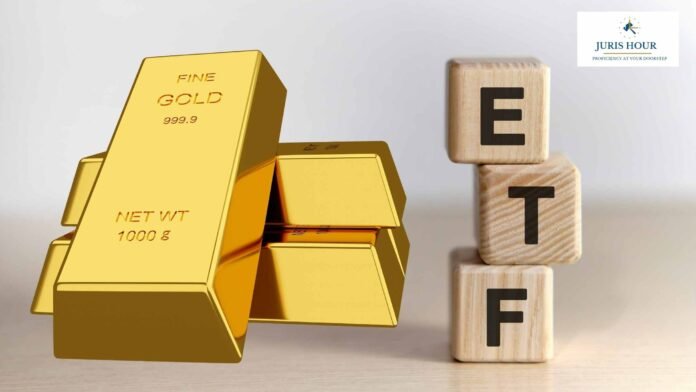
Gold has emerged as one of the strongest-performing asset classes for Indian investors over the past year, with Gold ETFs benefiting from the sharp rise in domestic gold prices. Recent market data shows that the leading Gold ETFs have generated around 50% or more over the latest one-year period, although the category has also experienced significant short-term volatility.
Buy Now: 70+ Judgements Indirect Tax – July 2026 | E-Magazine
Gold ETFs Deliver Over 50% in One Year
According to ACE MF data reported by Moneycontrol, the leading large Gold ETFs were delivering one-year returns of roughly 52% by August 17, 2026. The comparison covered schemes with assets under management of at least ₹1,500 crore, making it a useful screen for established funds rather than very small schemes.
Based on the latest available data, the following five ETFs stand out:
| Rank | Gold ETF | 1-Year Return* | 3-Year CAGR* | AUM* |
| 1 | Aditya Birla SL Gold ETF | 52.0% | 36.8% | ₹2,692.2 crore |
| 2 | DSP Gold ETF | 51.8% | 36.5% | ₹2,331.9 crore |
| 3 | ICICI Prudential Gold ETF | 51.9% | 36.7% | ₹25,821.8 crore |
| 4 | Mirae Asset Gold ETF | 51.6% | 36.6% | ₹3,164.7 crore |
| 5 | UTI Gold ETF | Earlier leading performer; 44.3% as of Aug. 3 | 36.2% as of Aug. 14 | — |
*Returns are based on the latest publicly reported ACE MF data available for different dates and therefore should not be interpreted as a single-day ranking. The first four figures are from August 17 data, while UTI’s latest reported three-year figure is from August 14. Rankings can change as gold prices and ETF NAVs move.
1. Aditya Birla SL Gold ETF
Aditya Birla SL Gold ETF has been one of the strongest performers in the category. ACE MF data reported on August 17 showed a 52.0% one-year return and a 36.8% three-year CAGR, placing it at the top of the latest one-year comparison among the large Gold ETFs.
The fund had already been leading the category earlier in the year. Moneycontrol reported a 45.8% one-year CAGR on June 24, demonstrating how quickly returns changed as the gold rally progressed.
Its relatively smaller asset base compared with some of the category giants does not necessarily imply poor performance. Investors, however, should examine trading liquidity, bid-ask spreads, expense ratio and tracking difference before investing.
2. DSP Gold ETF
DSP Gold ETF recorded a 51.8% one-year return and a 36.5% three-year CAGR in the August 17 comparison. Its performance has remained closely aligned with the other leading Gold ETFs because these funds essentially provide exposure to the same underlying commodity—gold.
The important point is that a 0.2–0.5 percentage-point difference between ETFs should not automatically be treated as evidence of a materially superior investment. Differences can arise from expenses, tracking error, portfolio management and the precise dates used for calculating returns.
3. ICICI Prudential Gold ETF
ICICI Prudential Gold ETF delivered a 51.9% one-year return and a 36.7% three-year CAGR according to the August 17 data. It also had by far the largest asset base among the funds considered in the comparison, with approximately ₹25,821.8 crore in assets.
Its scale is an important feature for investors because a larger fund generally has a more established trading ecosystem and substantial assets tracking the underlying gold market.
The ETF has also demonstrated consistency over longer periods. On August 14, UTI Gold ETF led the three-year chart at 36.2%, while Aditya Birla SL and ICICI Prudential followed at 35.8% each in that particular comparison.
4. Mirae Asset Gold ETF
Mirae Asset Gold ETF recorded a 51.6% one-year return and 36.6% three-year CAGR in the August 17 data.
The ETF has also appeared prominently in shorter-term performance comparisons. On August 18, it led the three-month category with a return of -2.7%, although DSP, Aditya Birla SL and other leading ETFs were virtually tied because gold prices had moved through a volatile phase.
This illustrates an important characteristic of Gold ETFs: even after an exceptionally strong one-year performance, short-term returns can turn negative.
5. UTI Gold ETF
UTI Gold ETF deserves attention because it has been particularly strong over longer periods. Moneycontrol reported that it led the three-year Gold ETF category with a 36.2% CAGR as of August 14, 2026.
Earlier, on August 3, UTI Gold ETF had recorded a 44.3% one-year CAGR and a 33.0% three-year CAGR.
The changing numbers demonstrate why investors should avoid selecting an ETF solely because it occupies the number-one position on a particular day or over a particular period.
Why Have Gold ETFs Delivered Such Strong Returns?
The spectacular performance of Gold ETFs is primarily a reflection of the underlying gold market rather than an equity-like stock-picking effect.
Gold experienced an extraordinary rally. Fortune India reported that gold generated close to 75% in rupee terms during 2025, its strongest annual performance since 1979.
The rally subsequently experienced a major correction in 2026. Reuters reported that gold fell from a January record near $5,595 per ounce to below $4,000 in June, before recovering to around $4,400 by August following renewed safe-haven demand.
That combination of a powerful long-term rally followed by a correction and rebound has produced unusually high trailing one-year returns.
But Recent Returns Have Also Become Volatile
The headline one-year numbers should not obscure what happened over shorter periods.
The latest data showed that the leading Gold ETFs had negative three-month returns of around -2.7%, even while their one-year returns exceeded 50%.
This is a useful reminder that trailing returns can look extremely attractive after a large rally. An investor buying after such a rally can experience a very different return over the following months.
Gold itself also remains sensitive to geopolitical developments, interest-rate expectations, the US dollar, central-bank purchases and investor demand. Reuters recently noted that gold’s August recovery followed renewed safe-haven demand, but also highlighted risks from weak jewellery demand and the possibility that gold had become technically overbought.
Gold ETF vs Physical Gold
Gold ETFs provide exposure to gold without requiring the investor to purchase, store and insure physical bullion.
The principal advantages include:
Liquidity: Gold ETFs are traded on stock exchanges during market hours.
No physical storage: Investors do not need lockers, insurance or physical handling.
Price transparency: ETF prices are linked closely to the underlying gold market.
Diversification: Gold can provide diversification within a broader investment portfolio.
However, Gold ETFs are not identical to holding jewellery or physical bars. Their returns can differ from the headline gold price because of expenses, tracking difference, transaction costs and market liquidity.
What Should Investors Compare Before Choosing a Gold ETF?
Past return should be only one part of the analysis.
1. Tracking Difference
The objective of a Gold ETF is generally to track the price of gold. The smaller the persistent gap between the ETF’s performance and its benchmark, the better the tracking efficiency.
2. Expense Ratio
Even a small annual cost can affect long-term returns. Investors should compare the latest expense ratios rather than relying on historical figures.
3. Liquidity and Bid-Ask Spread
Two ETFs can have similar NAV performance but different trading experiences. Higher trading activity and tighter spreads can be advantageous for investors who buy or sell on the exchange.
4. Fund Size
A larger AUM can indicate established investor participation, although size by itself is not a guarantee of better returns.
ICICI Prudential Gold ETF, for example, had approximately ₹25,821.8 crore in assets in the latest comparison, considerably more than the other funds in the selected group.
5. Performance Across Multiple Periods
Instead of looking only at the one-year return, investors should examine one-year, three-year and longer-term performance together.
The August data provides a good illustration: Aditya Birla SL Gold ETF led the one-year chart, while UTI Gold ETF led the three-year chart.
Does the Highest-Returning Gold ETF Automatically Make the Best Investment?
Not necessarily.
When Gold ETFs track the same underlying commodity, differences in returns among established funds can be relatively small. A fund that ranks first over one year may fall behind another fund over three or five years.
For example, the latest data showed Aditya Birla SL Gold ETF ahead on the one-year measure, while UTI Gold ETF topped the three-year comparison.
Therefore, investors should consider tracking efficiency, costs, liquidity, fund size and consistency rather than selecting a fund purely on the basis of its latest return ranking.
The Bigger Picture for Gold in 2026
Gold’s performance in 2026 has been shaped by an unusual combination of geopolitical uncertainty, changing interest-rate expectations, central-bank activity and fluctuations in the US dollar.
Gold rebounded strongly in August after its mid-year correction. Reuters reported that the metal had recovered about 9% to approximately $4,400 an ounce by August 17.
At the same time, the recent correction demonstrates that gold is not a one-way investment. Even an asset traditionally regarded as a safe haven can experience substantial drawdowns.

